
By Harlan Kirgan
Editor
Facebook might be top of mind for social media among adults, but don’t expect teens to hang around that site.
A survey of teens attending the annual St. Landry Parish Boldly Living As Smart Teens event offers a window in the world of 11- to 14-year-olds in the parish.
The survey found teens don’t hang out on Facebook so much, but their parents do.
That’s the sort of insight come from the survey presented to the 935 youths from 15 schools participating in the 17th annual program held Aug. 24 at the Yambilee in Opelousas.
The daylong event includes speakers presented by STL Proud and St. Landry Parish Children and Youth Services Planning Board.
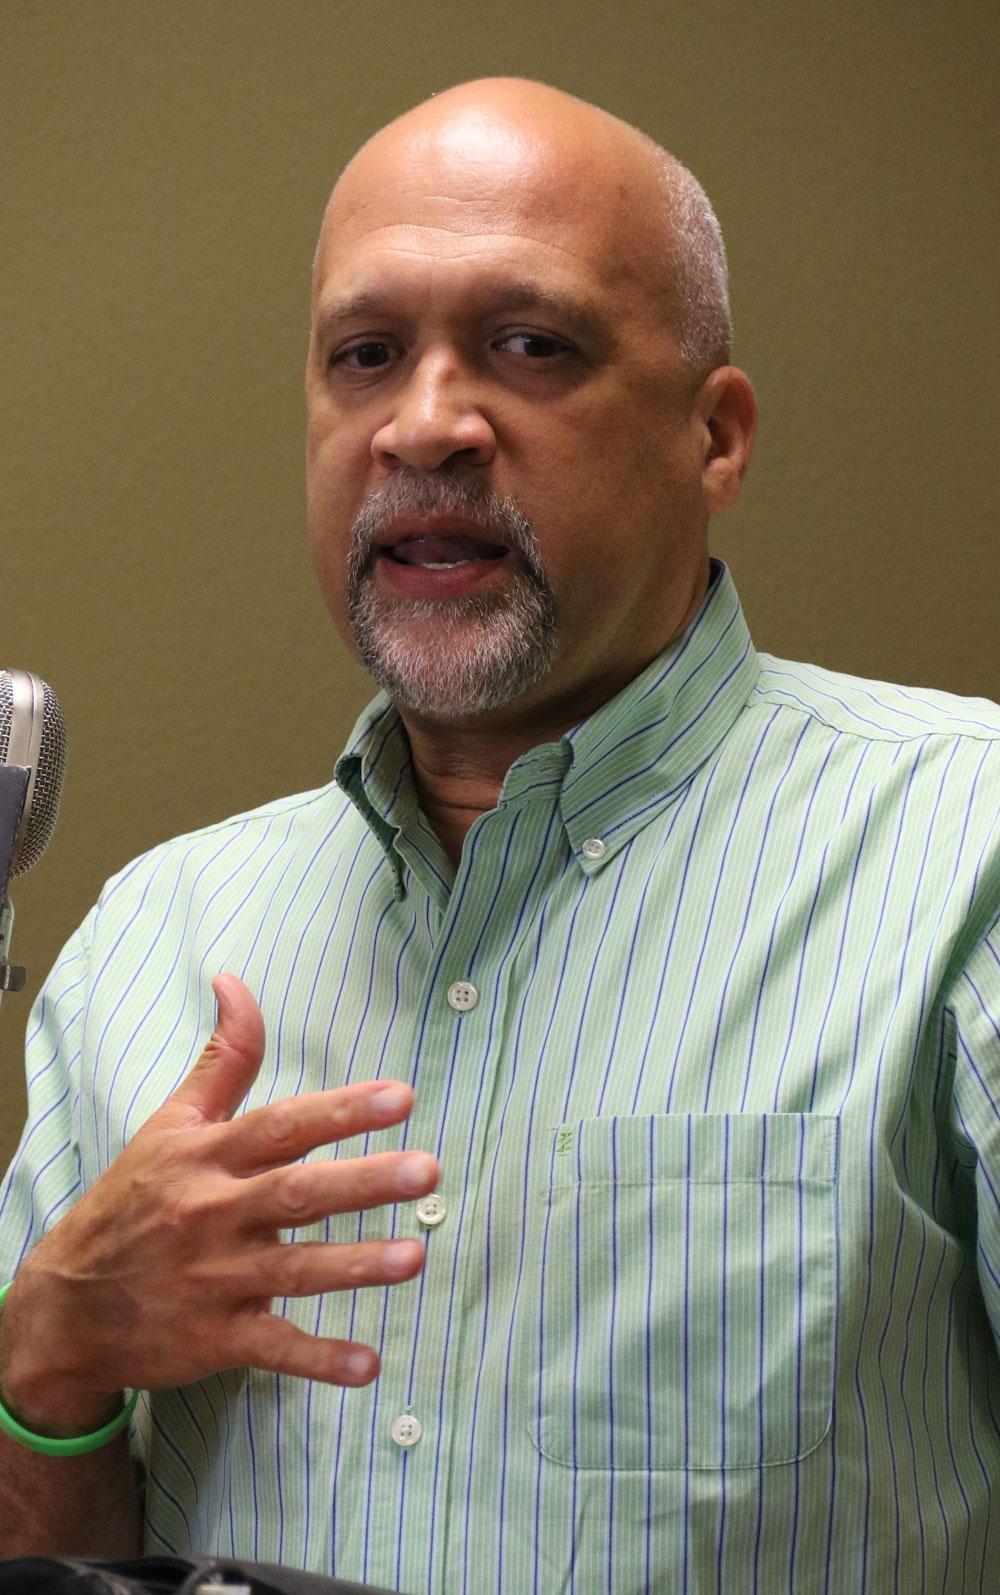
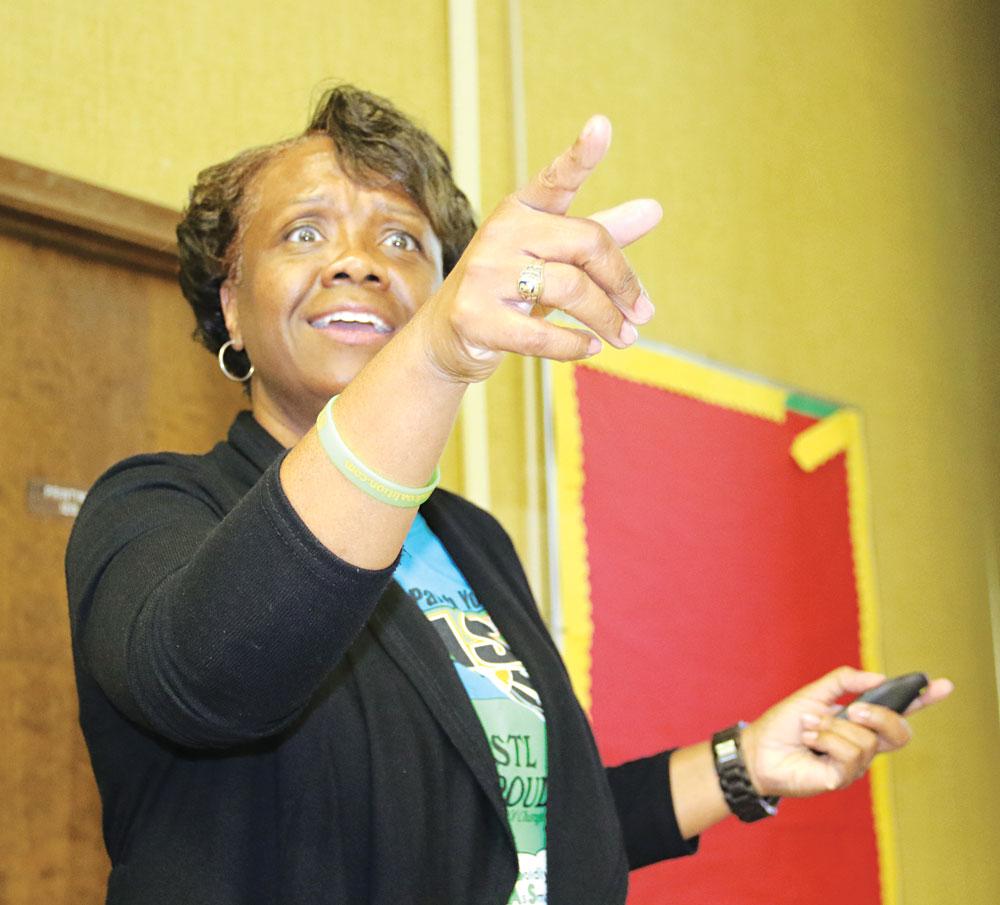
The Rev. Fontenot, of STL Proud, and LaVonya Malveaux, and Opelousas City Court administrator, presented the survey results to the Nov. 1 St. Landry Parish School Board meeting.
Fontenot said the survey is used to help develop ways to influence students. The parish has one of the highest levels of underage drinking in the state, he said.
Here’s the survey questions and responses presented the Board meeting.
What type of bonding experiences do you have regularly with your family? 795 respondents.
Vacations/road trips: 66.79 percent; 531 respondents.
Eating dinner together: 59.25 percent; 471 respondents.
Watching television together: 58.87 percent; 468 respondents.
Reading books: 5.79 percent; 46 respondents.
Going to the movies: 51.57 percent; 410 respondents.
Recreational events in the community (fairs, festivals, concerts) — 50.19 percent; 399 respondents.
If you do not have regular bonding experiences with your family, what type of bonding experiences would you like to have? 548 respondents.
Vacations/road trips: 45.99 percent; 252 respondents.
Eating dinner together: 31.02 percent; 170 respondents.
Watching television together: 26.64 percent; 146 respondents.
Reading books: 20.07 percent; 110 respondents.
Going to the movies: 38.14 percent; 209 respondents.
Recreational events in the community (fairs, festivals, concerts) — 35.77 percent; 196 respondents.
Do your parents have social media accounts? 805 respondents.
Yes: 81.74 percent; 658 respondents.
No: 8.82 percent; 71 respondents.
I don’t know: 9.44 percent; 76 respondents.
If yes, what type of social media account do they have? 699 respondents.
Facebook: 92.85 percent; 649 respondents.
Twitter: 11.59 percent; 81 respondents.
Instagram: 56.65 percent; 396 respondents.
Snapchat: 49.79 percent; 348 respondents.
Periscope: 1.14 percent; 8 respondents.
Other: 0.43 percent; 3 respondents.
Do you have social media accounts? 800 respondents.
Yes: 73 percent; 584 respondents.
No: 24.75 percent; 198 respondents.
I don’t know: 2.25 percent; 18 respondents.
If yes, what type of social media account do they have? 604 respondents.
Facebook: 22.52 percent; 136 respondents.
Twitter: 17.05 percent; 103 respondents.
Instagram: 80.30 percent; 485 respondents.
Snapchat: 79.97 percent; 483 respondents.
Periscope: 1.99 percent; 12 respondents.
Other: 6.79 percent; 41 respondents.
What type of events do you and your friends participate in for fun outside of school? 730 respondents.
Playing recreational sports: 58.22 percent; 425 respondents.
Attending neighborhood social events: 17.67 percent; 129 respondents.
Watching television together: 38.77 percent; 283 respondents.
Listening to music together: 50.55 percent; 369 respondents.
Going to the movies: 49.18 percent; 359 respondents.
Other: 11.37 percent; 83 respondents.
How do you and your friends most frequently communicate? 801 respondents.
Talking on the phone: 30.59 percent; 245 respondents.
Talking in person: 43.82 percent; 351 respondents.
Texting: 13.73 percent; 110 respondents.
Via social media (facebook, instagram, snapchat, etc): 11.86 percent; 95 respondents.
Do you have siblings between the ages of 18–25 (If “no” skip to question 11)? 747 respondents.
Yes: 49.53 percent; 370 respondents.
No: 50.47 percent; 377 respondents.
If yes, what do your siblings most frequently do for fun? 419 respondents.
Spend time with peers/friends their age: 58.71 percent; 246 respondents.
Go to clubs/bars: 7.16 percent; 30 respondents.
Attend sporting events: 13.84 percent; 58 respondents.
Volunteer with local organizations: 2.86 percent; 12 respondents.
Spend time on social media: 17.42 percent; 73 respondents.
Who inspires you the most? 786 respondents.
Your parents: 65.65 percent; 516 respondents.
A teacher(s): 3.94 percent; 31 respondents.
Celebrity/sports figure: 20.10 percent; 158 respondents.
Religious leader or church member: 3.18 percent; 25 respondents.
Peers/friends your age: 7.12 percent; 56 respondents.
Which activity do you observe your parents engaging in most often? 744 respondents.
Going out to dinner: 50.27 percent; 374 respondents.
Volunteering at local organizations: 7.66 percent; 57 respondents.
Drinking alcohol: 7.39 percent; 55 respondents.
Reading: 7.93 percent; 59 respondents.
Attending church/religion affiliated events: 26.75 percent; 199 respondents.
What is your overall opinion of the Youth BLAST? 786 respondents.
It was great!: 63.36 percent; 498 respondents.
It was just okay: 22.77 percent; 179 respondents.
It could have been better: 9.80 percent; 77 respondents.
I’d rather be at school: 4.07 percent; 32 respondents.
Sex. 804 respondents.
Male: 48.88 percent; 393 respondents.
Female: 51.12 percent; 411 respondents.
Race. 800 respondents.
Black: 54.37 percent; 435 respondents.
White: 42.13 percent; 337 respondents.
Other: 3.50 percent; 28 respondents.
Age. 787 respondents.
Age 11: 4.70 percent; 37 respondents.
Age 12: 66.20 percent; 521 respondents.
Age 13: 22.62 percent; 178 respondents.
Age 14: 5.97 percent; 47 respondents.
School. 821 respondents.
Arnaudville Elementary: 5.24 percent; 43 respondents.
Eunice Jr. High: 17.66 percent; 145 respondents.
JS Clark Leadership Academy: 3.90 percent; 32 respondents.
Krotz Springs Elementary: 3.05 percent; 25 respondents.
Lawtell Elementary: 8.53 percent; 70 respondents.
Leonville Elementary: 4.14 percent; 34 respondents.
MACA: 6.58 percent; 54 respondents.
North Central Middle: 4.26 percent; 35 respondents.
Opelousas Jr. High: 10.96 percent; 90 respondents.
Plaisance Elementary: 5.72 percent; 47 respondents.
Port Barre Middle: 10.11 percent; 83 respondents.
Sunset Elementary: 10.60 percent; 87 respondents.
Washington Elementary: 1.34 percent; 11 respondents.
Family Worship Christian Academy: 1.83 percent; 15 respondents.
Opelousas Catholic: 6.09 percent; 50 respondents.